AI Code Acceptance Rate vs Real Productivity: What the Data Actually Shows
AI coding acceptance rates look impressive. The data on code churn, defects, and controlled studies tells a more complicated story for enterprise teams.
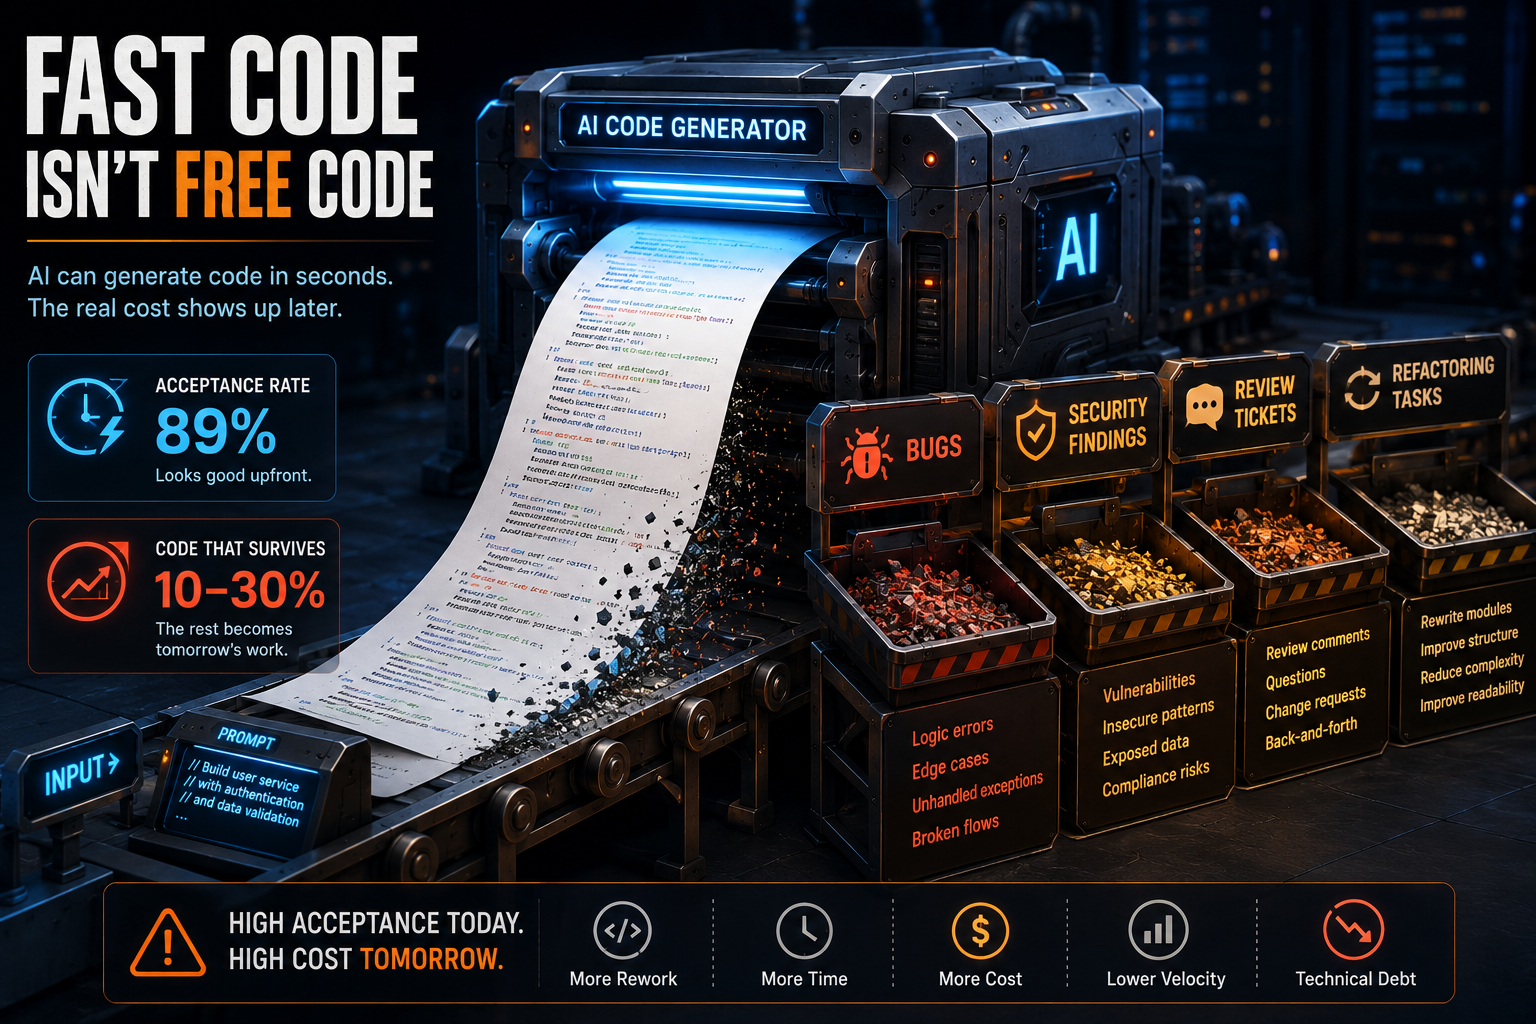
Every engineering leader has seen the acceptance rate numbers. GitHub Copilot and similar tools report acceptance rates in the 80 to 90 percent range, and the natural conclusion is that AI is writing most of your code and writing it well. That conclusion does not survive contact with the data that looks past the moment of acceptance.
The real-world picture, once post-merge churn settles, looks closer to 10 to 30 percent of AI-generated code surviving without significant rewrite. The other 70 to 90 percent gets rewritten, refactored, or quietly carried as technical debt until someone flags it. Acceptance is not retention, and the gap between those two numbers is where most of the AI productivity story either holds up or falls apart.
This article walks through what the most rigorous studies actually measured, where the productivity gains are real, where they are illusory, and what that means for how engineering teams should evaluate their own AI adoption in 2026.
If your team has adopted AI coding tools and you are trying to understand whether the velocity gains are showing up in your actual delivery metrics or only in your acceptance rate dashboard, that is precisely the kind of question Marka's QA and DevOps Automation practice helps enterprise teams answer. You can reach the team at marka-development.com/contacts.
The Acceptance Rate Number Everyone Quotes, and Why It Is Misleading
Acceptance rate measures one thing: whether a developer pressed tab to accept a suggestion at the moment it appeared. It does not measure whether that code survived the next code review, the next sprint, or the next production incident. A high acceptance rate tells you that AI suggestions look plausible enough in the moment to take. It tells you nothing about whether they were correct.
The more meaningful number is what happens after acceptance. Research synthesizing controlled experiments and production analytics describes this as the seventy percent problem. AI handles scaffolding and boilerplate effectively, the easy seventy percent of a task, but struggles with edge cases, error handling, and integration logic, the hard thirty percent that actually determines whether software works correctly in production. Code that looks correct and passes basic tests can still contain subtle errors that surface weeks later, long after the acceptance rate metric has already been logged as a win.
This is also where the security picture gets concerning. A CodeRabbit study analyzing 153 million lines of code found that AI co-authored code carries 2.74 times more security vulnerabilities and 75 percent more logic and correctness defects than human-written code. Those defects do not show up in the acceptance rate. They show up in the security audit, the production incident, or the technical debt backlog months later.
What the METR Study Actually Found
If one study deserves to reshape how engineering leaders think about AI coding productivity, it is the randomized controlled trial published by METR, the Model Evaluation and Transparency Research nonprofit, in mid-2025. It is worth understanding in detail because it is the methodological gold standard in a field that is otherwise dominated by vendor-published benchmarks and self-reported surveys.
The study recruited sixteen experienced open-source developers, each with an average of five years and roughly 1,500 commits of prior experience on the specific repositories they worked in. These were not novices working on toy problems. They were experts working in codebases they knew intimately. Each of the 246 tasks they completed was randomly assigned to either allow or disallow the use of AI tools, primarily Cursor Pro with Claude 3.5 and 3.7 Sonnet, the frontier tools available in early 2025.
Before the study began, the developers predicted that AI assistance would reduce their task completion time by 24 percent. After completing the study, having actually used the tools, they estimated that AI had helped them by 20 percent.
The actual result was the opposite. Developers who used AI tools took 19 percent longer to complete their tasks than developers who did not.
What makes this finding significant is not just the direction of the effect, but the fact that developers continued to believe AI had helped them even after experiencing the slowdown directly. The researchers ruled out measurement error and poor time estimation as explanations. The developers were accurate in predicting how long tasks would take both with and without AI. The disconnect was specifically about the impact of AI itself, and it persisted even after the experience that should have corrected it.
The study identified several contributing factors. Developers spent significant time reviewing, correcting, and cleaning up AI-generated output, time that does not show up in any acceptance rate metric but consumes the bulk of the task. The AI tools performed worse in large, mature, complex codebases with high quality standards, the exact environment most enterprise development happens in. And there was a documented gap between AI reliability and developer trust: developers spent time double-checking outputs that they might have written correctly themselves the first time.
METR's own framing of the result is important context. The factors contributing to the slowdown were specific to the setting studied, experienced developers working in mature codebases they knew well. The study does not claim AI tools are universally unhelpful. It claims that the productivity story is far more dependent on task type, codebase maturity, and developer familiarity than the marketing narrative suggests.
Where the Gains Are Real
The picture is not uniformly negative, and treating it as such would be as misleading as treating the acceptance rate as the full story. Controlled experiments consistently show real speedups for specific, scoped task types.
A widely cited GitHub and Microsoft study of 4,800 developers found that developers completed a representative coding task 55 percent faster with Copilot than without it, with average completion times of one hour eleven minutes versus two hours forty-one minutes. Google reports approximately a 10 percent increase in overall engineering velocity attributable to AI tools, with 25 to 30 percent of new code at Google now AI-generated, though all of it passes through human review before merging.
The pattern across these studies is consistent: AI delivers measurable speedups for greenfield features, boilerplate generation, writing tests, and tasks where the developer is working in unfamiliar territory or a codebase they do not know well. AI is less helpful, and can actively slow things down, in mature, complex, well-understood codebases where an experienced developer's own knowledge is already close to optimal and the AI's suggestions require more verification than they save.
This distinction matters enormously for how enterprise teams should think about AI adoption. Most enterprise codebases are mature, complex, and maintained by developers who know them well, exactly the environment where METR found AI tools provide the least benefit and can introduce a net slowdown once review and correction time is accounted for.
The Metric That Matters: Code Churn, Not Acceptance
If acceptance rate is the wrong metric, what is the right one? Code churn, the rate at which newly written code is revised or rewritten shortly after being merged, is a far more direct signal of whether AI-generated code is actually production-ready or whether it is being accepted now and fixed later.
GitClear's analysis of 211 million changed lines of code from 2020 to 2024, sourced from repositories at major technology companies and enterprise customers, found that code churn, defined as new code revised within two weeks of being written, rose from 3.1 percent in 2020 to 5.7 percent in 2024. That increase tracks closely with the timeline of AI coding tool adoption, and it represents a near-doubling of the rate at which code is being rewritten almost immediately after it is written.
Separately, SonarSource's research on code quality found that projects that over-relied on AI-generated code saw 41 percent more bugs and a 7.2 percent drop in system stability. The mechanism behind both findings is the same: when a developer can generate 200 lines of code in 30 seconds, the natural response is to spend less time reviewing it, not more. Speed at generation time creates an incentive to reduce scrutiny precisely when scrutiny matters most.
For engineering leaders evaluating their own AI adoption, code churn, defect escape rate, and post-merge revision frequency tell a far more complete story than acceptance rate ever will. An organization that has not started tracking these metrics has no way to know whether its AI tooling is delivering durable productivity or borrowing speed against future rework.
What This Means for Enterprise Engineering Teams
The synthesis across controlled experiments, production analytics, and security research points to a consistent conclusion: AI coding tools produce real, measurable task-level speedups under specific conditions, but those speedups do not automatically translate into organizational productivity gains, and in mature enterprise codebases they can produce a net slowdown once review, correction, and rework are accounted for.
The organizations that convert AI-assisted speed into durable productivity share a common pattern. They instrument their delivery metrics before expanding AI usage, establishing a baseline of code churn, defect escape rate, and cycle time for at least one full quarter. They pilot AI tools with explicit governance: defined task types where AI assistance is encouraged, defined task types where it is restricted or requires additional review, and clear escalation when AI-generated code introduces new architectural patterns or dependencies that were not part of the original design.
They also treat code review capacity as the actual bottleneck, not code generation speed. If AI tools can generate code faster than the team can review it properly, the organization has not gained velocity. It has shifted the bottleneck downstream and is accumulating the difference as technical debt that will surface later, in exactly the way GitClear's churn data and SonarSource's bug rate data describe.
For organizations running compliance-sensitive development under frameworks like NIS2, DORA, or ISO 27001, this has a direct governance implication. An SDLC audit that does not explicitly assess how AI-generated code is reviewed, attributed, and tracked separately from human-written code is auditing a process that no longer reflects how the codebase is actually being built. Marka's SDLC audit work increasingly includes this assessment as a standard component, because the gap between acceptance rate and production-ready code is exactly the kind of process risk that does not show up until it becomes an incident or a failed compliance review.
What to Do Next
Three steps are worth taking before expanding AI tool usage further, or before assuming that current usage is delivering the productivity gains it appears to on the surface.
Start tracking code churn and defect escape rate, not just acceptance rate. If your organization cannot currently answer the question "what percentage of AI-generated code is rewritten within two weeks of being merged," that is the first gap to close. The answer will tell you more about your actual AI productivity than any acceptance rate dashboard.
Segment AI usage by task type and codebase maturity. The data is clear that AI delivers different results for greenfield work versus mature codebases, and for boilerplate versus complex integration logic. A blanket AI adoption policy applied uniformly across all of these contexts will produce uneven and hard-to-interpret results. A policy that matches AI usage to the contexts where the data shows it helps will produce better outcomes and clearer metrics.
Assess whether your review process has scaled with your AI adoption. If code generation speed has increased but code review capacity has not, the bottleneck has moved, not disappeared. An honest assessment of review capacity against current AI-assisted output volume is often the single most revealing exercise an engineering organization can run.
If your team is working through how to measure this honestly, or needs an outside assessment of where AI-generated code sits in your current delivery pipeline, Marka's team can help. Reach out at marka-development.com/contacts or review the QA and DevOps Automation work the team delivers for enterprise clients.