How to Build a Retail Analytics Platform That Connects POS, CRM, and Loyalty Data
Most retailers have POS, CRM, and loyalty data but no single customer view. Here is the 8-step plan to build a retail analytics platform that connects it.
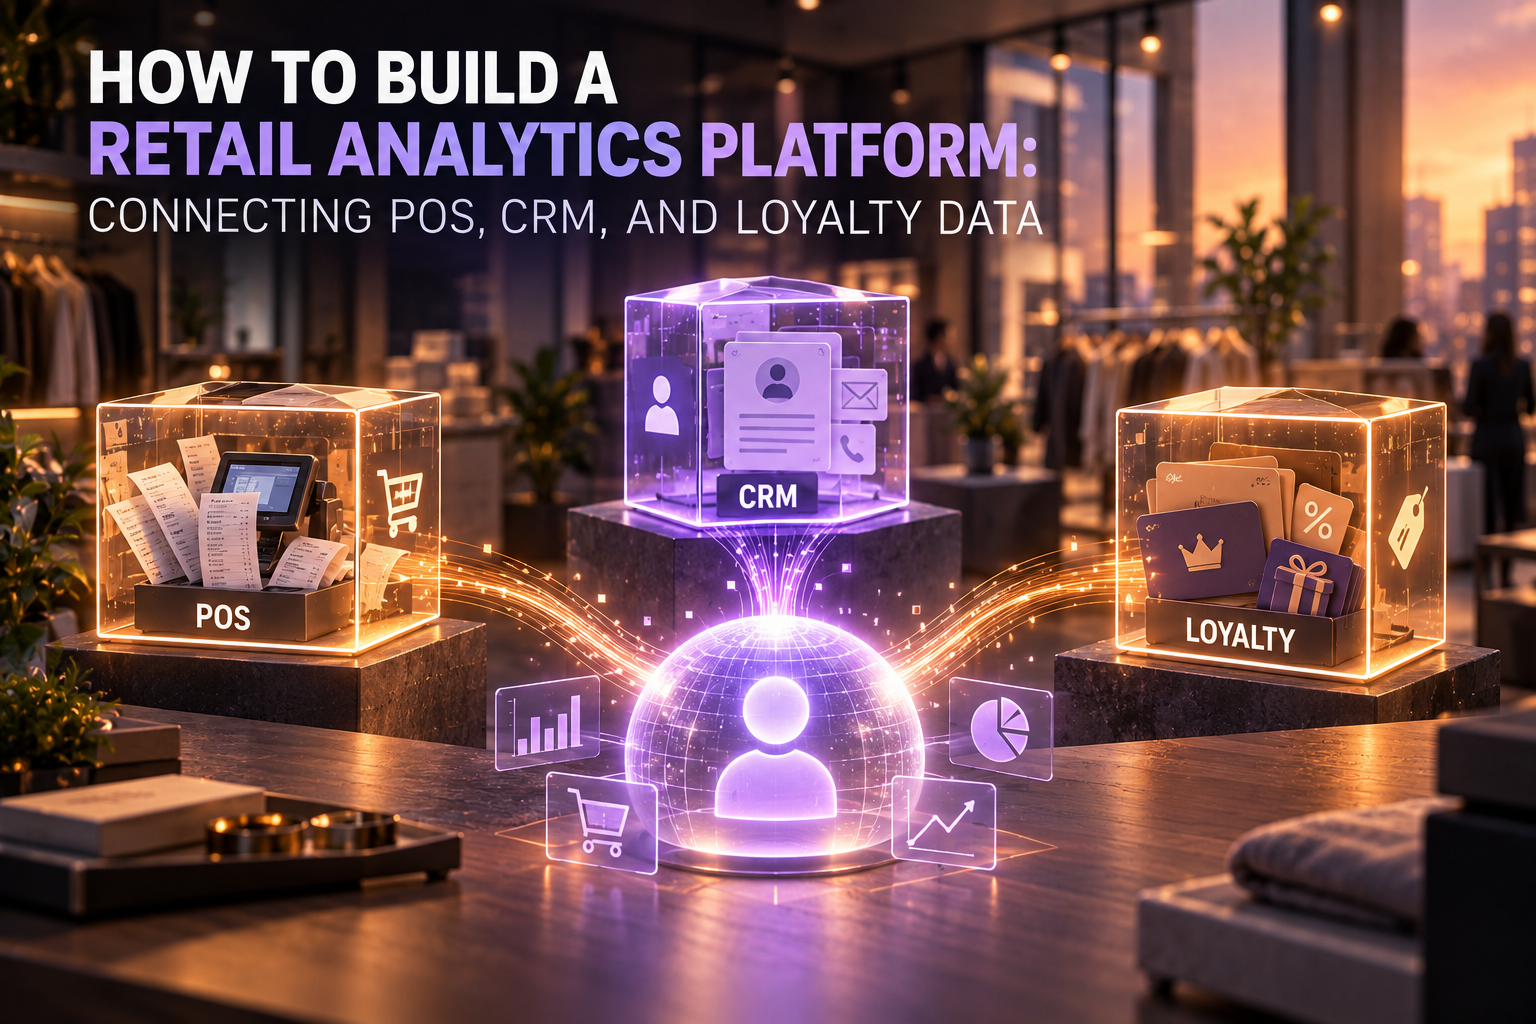
Most retailers already own the data they need to understand their customers. The point-of-sale system records every basket. The CRM holds names, emails, and service history. The loyalty program tracks points, tiers, and redemptions. The problem is that these three systems were bought at different times, by different teams, to solve different problems, and almost none of them were designed to talk to each other.
The result is a familiar pattern. Marketing knows who the loyalty members are but not what they buy in store. Store operations know what sold but not who bought it. Finance reports revenue that no one can tie back to a customer segment. Every team works from a partial truth, and every cross-functional question turns into a two-week spreadsheet project.
A Bain and Aptos study found that only about half of retailers believe their current technology can support their unified commerce ambitions, and integrating purchase history through unified POS and CRM systems ranks among their top investments. The ambition is clear. The execution is where most programs stall.
This guide covers how to build a retail analytics platform that connects POS, CRM, and loyalty data into one trusted customer view: the reference architecture, the eight build steps, the identity resolution problem that decides whether the whole project works, the data model, privacy and consent design, the build versus buy decision, and the mistakes that turn a 6-month project into a 2-year one.
Why POS, CRM, and Loyalty Data Stay Disconnected
The disconnect is not a technology failure. It is an ownership failure that technology then makes permanent.
POS data belongs to store operations. It is optimized for transaction speed and end-of-day reconciliation, not for customer analysis. Most POS systems store a receipt, a store ID, a terminal ID, a timestamp, and line items. A customer identifier is optional, and in most stores it is missing from the majority of transactions.
CRM data belongs to marketing or customer service. It is optimized for contact management and campaigns. It knows email addresses, consent flags, and support tickets, but it usually receives purchase data as a nightly summary, if at all.
Loyalty data often belongs to a third-party vendor. Many loyalty platforms are SaaS products with their own member IDs, their own points ledger, and an export API that was added as an afterthought. The retailer owns the relationship but rents the data structure.
Each system has its own definition of a customer, its own identifier, and its own idea of what a transaction is. A return in the POS might be a negative line item. In the loyalty platform it is a points reversal. In the CRM it may not exist at all.
The identification gap makes this worse. Industry analysis from Total Retail notes that digital loyalty programs can reach match rates of up to 30 percent, while in-store identification often stays in the single digits. That means most of the revenue flowing through your tills cannot currently be tied to any customer at all.
A TCS survey found that a third of retailers cannot build single customer views across channels, and only 3 percent describe their experience as truly unified. The gap between knowing the value of connected data and actually having it is wide.
What a Connected Retail Analytics Platform Actually Does
Before architecture, it helps to be precise about outcomes. A connected platform is not a dashboard project. It is the foundation that makes these questions answerable in minutes rather than weeks:
- Which customer segments are growing or shrinking, and in which stores?
- What is the real lifetime value of a loyalty member compared to a non-member with similar first purchases?
- Which promotions drove incremental revenue and which simply subsidized purchases that would have happened anyway?
- Which customers are showing early churn signals, such as longer gaps between visits or a shrinking basket?
- Which products do high-value customers buy together, across online and in-store channels?
- Which loyalty rewards actually change behavior, and which are redeemed by people who would have bought regardless?
The commercial case for answering those questions is well documented. McKinsey research shows that personalization typically drives 10 to 15 percent revenue lift, with company-specific results ranging from 5 to 25 percent depending on sector and execution. Personalization at that level is impossible when purchase history, contact data, and loyalty status live in three systems that cannot agree on who the customer is.
The Reference Architecture in Six Layers
A retail analytics platform that connects POS, CRM, and loyalty data has six layers. The technology choices within each layer vary. The layers themselves do not.
- Source systems. POS, CRM, loyalty platform, and usually ecommerce, inventory, and ERP.
- Ingestion. Batch extracts, change data capture, APIs, and event streams that move data out of source systems without disrupting them.
- Raw storage. A landing zone that keeps an untouched copy of every source record, so you can reprocess history when business rules change.
- Identity and integration. The layer that resolves customer identity across systems and conforms products, stores, and dates into shared definitions.
- Analytical model and metrics. A dimensional model and a single semantic layer where metrics such as customer lifetime value, retention, and incremental revenue are defined once.
- Consumption and activation. BI dashboards, self-service analysis, machine learning models, and reverse ETL that pushes segments back into the CRM and loyalty platform.
Most failed retail data projects skip layer 3 or underinvest in layer 4. Skipping raw storage means every rule change requires re-extracting years of data from production systems. Underinvesting in identity means every downstream number is quietly wrong.
Step 1: Start With Decisions, Not Data Sources
The most common way to start a retail analytics project is to list every data source and plan to connect them all. It is also the most expensive way to start.
Start instead with five to ten decisions the business wants to make better. "Which stores should get the spring promotion budget" is a decision. "We want a 360-degree customer view" is not. Each decision implies specific metrics, each metric implies specific data, and that chain defines your first release scope.
A practical first-release scope for most retailers looks like this:
- Sales, margin, and basket metrics by store, category, and day
- Customer counts, visit frequency, and spend by segment for identified customers
- Loyalty member versus non-member performance
- Promotion and redemption performance
Everything else, from churn prediction to real-time personalization, comes after the foundation proves it can be trusted. A structured discovery phase is the cheapest place to make these scope decisions.
Step 2: Audit the Three Source Systems
Before writing a single pipeline, document how each source system actually behaves. Vendor documentation describes how the system is supposed to work. Production data shows how it really works.
For each system, answer these questions:
- Identifiers. What uniquely identifies a customer, a transaction, a product, and a store? Do those IDs ever get reused or reassigned?
- Change behavior. Are records updated in place, or are changes appended? Are deletes hard or soft?
- Extraction options. Is there an API, a database you can read from, file exports, or webhooks? What are the rate limits?
- History. How far back does the data go, and was the schema different in earlier years?
- Edge cases. How are returns, exchanges, voids, split payments, gift cards, staff discounts, and offline transactions recorded?
The edge cases matter more than they appear. A POS that records returns as new negative transactions with no link to the original sale will silently inflate customer counts and distort basket analysis until someone builds the logic to pair them.
Profile the data during this audit. Gartner reports that 59 percent of organizations do not measure data quality at all. Measuring null rates, duplicate rates, and format consistency in the first two weeks prevents months of debugging later.
Step 3: Build the Ingestion Layer
Each source system needs an ingestion pattern that matches how it changes and how quickly the business needs the data.
Batch extraction works for most POS reporting. Stores close, the POS reconciles, and a nightly or hourly extract lands in raw storage. It is simple, cheap, and adequate for the large majority of retail analytics questions.
Change data capture (CDC) reads the database transaction log and streams inserts, updates, and deletes as they happen. Open-source tools such as Debezium make this practical for CRM and loyalty databases you control. CDC is the right choice when records are updated in place and you need to see every version, for example a loyalty tier that changes during the month.
API polling and webhooks are usually the only option for SaaS loyalty and CRM platforms. Build these with idempotent loading, so a retried request never creates duplicate records, and with watermarks, so each run picks up exactly where the last one stopped.
Event streaming is justified when there is a real-time use case with real revenue attached, such as triggering a personalized offer at the till or detecting fraud during a transaction. It is not justified for a dashboard that someone checks once a day. Real-time pipelines cost significantly more to build and operate, a point we covered in our article on FinOps for engineering teams.
Whatever the pattern, land the data unchanged in raw storage first. Transformation happens later, in code that is versioned and testable. If your team is considering an append-only approach for transaction history, our analysis of event sourcing versus traditional databases explains when that pattern earns its complexity.
Step 4: Solve Customer Identity Resolution
This is the step that decides whether the platform works. Every customer metric, from lifetime value to churn rate, depends on knowing that the loyalty member, the CRM contact, and the person behind POS receipt 48213 are the same human being.
Identity resolution has two approaches, and most retailers need both.
Deterministic matching links records that share an exact identifier: the same loyalty card number scanned at the till, the same verified email in the CRM and the loyalty app, the same phone number entered at checkout. It is accurate, explainable, and easy to audit. Its weakness is coverage, because it only works when a shared identifier exists.
Probabilistic matching links records that are likely to belong to the same person based on combinations of weaker signals, such as name similarity, postal address, and purchase patterns. It increases coverage but introduces false matches, which need confidence scores and review rules.
The practical design that works for most retailers:
- Assign every resolved person a platform-owned ID, for example
customer_key, that never changes and never leaves the analytics platform. - Keep a mapping table, for example
identity_map, that links every source identifier (POS card token, CRM contact ID, loyalty member ID, ecommerce account ID) to that key, with the match method, confidence, and date. - Normalize before matching. Lowercase and trim emails, convert phone numbers to E.164 format, and standardize addresses.
- Apply deterministic rules first. Use probabilistic rules only above a confidence threshold that the business has agreed to.
- Handle merges and splits explicitly. When two profiles turn out to be one person, or one profile turns out to be two people sharing a card, the history must be re-attributed and every downstream metric recalculated.
Then work on increasing identification at the source. Digital receipts, app-based loyalty scanning, and checkout prompts that ask for a phone number or email all raise the share of transactions that can be linked. Every percentage point of identification you add at the till is worth more than any matching algorithm you add in the warehouse.
Step 5: Model the Data for Retail Questions
Raw data from three systems does not answer business questions. A dimensional model does. The pattern that has worked for retail analytics for decades is still the right default: fact tables for events, dimension tables for context.
A typical core model looks like this:
fact_sales_lineholds one row per item sold, with quantity, price, discount, margin, store, date, product, andcustomer_keywhere known.fact_loyalty_eventholds points earned, points redeemed, tier changes, and enrollment events.fact_customer_interactionholds campaign sends, opens, clicks, and service contacts from the CRM.dim_customerholds the resolved customer profile, with history tracked over time so a customer's segment in March stays visible even after it changes in June.dim_product,dim_store,dim_date, anddim_promotionprovide the shared context that every fact table joins to.
Two modeling decisions cause most of the downstream pain if they are made carelessly.
Track history on the customer dimension. If a customer moves from Silver to Gold tier, reports for last quarter should still show them as Silver. Slowly changing dimensions solve this. Overwriting the tier field does not.
Keep anonymous transactions in the model. Unidentified sales are still revenue. Assign them to an "unknown customer" member rather than dropping them, so that store and product totals reconcile with finance, and so you can track identification rate as a metric in its own right.
Step 6: Define the Metrics Layer Once
A retail analytics platform fails quietly when two dashboards show two different numbers for the same metric. Marketing calculates active customers as anyone who purchased in 12 months. Finance uses 6 months. The loyalty team counts members who logged in. All three numbers appear in the same board meeting.
The fix is a semantic layer, where every core metric has one definition, one owner, and one implementation in code. At minimum, define these before the first dashboard is published:
- Active customer: the exact purchase window and channel rules
- Retention rate: the cohort definition and the period
- Customer lifetime value: historical or predictive, gross or net of returns, with or without margin
- Incremental revenue: the control group method used for promotions and loyalty rewards
- Identification rate: the share of transactions and revenue linked to a known customer
The Bond Loyalty Report 2025 found that consumers belong to 17.4 loyalty programs on average, yet only 48 percent of Americans say they are very satisfied with their program. With that much competition for attention, loyalty teams need metrics that show incremental behavior change, not just points issued.
Step 7: Activate the Data, Not Just Report It
Dashboards explain what happened. Activation changes what happens next. A connected platform should push its outputs back into the systems where customers are served.
Reverse ETL sends computed segments and scores from the warehouse back into the CRM and loyalty platform. A churn risk score calculated nightly becomes a field the CRM can use to trigger a win-back campaign.
Clienteling tools give store staff a view of the customer's history and preferences when the customer identifies themselves, which turns the POS from a payment terminal into a service tool.
Personalized offers use purchase history from all channels, not just the channel where the offer is shown.
AI-driven use cases such as next-best-offer models, demand forecasting by customer segment, and conversational product discovery all depend on the same clean, connected foundation. We explored the commerce side of this in AI product discovery for ecommerce, and the infrastructure side in why most architectures cannot support AI.
Step 8: Build Privacy and Consent Into the Pipeline
Connecting POS, CRM, and loyalty data creates something none of the individual systems held: a detailed behavioral profile of identifiable people. In the EU and UK, that profile falls squarely under GDPR, and the design decisions you make here are legal decisions as much as technical ones.
Build these controls into the platform, not around it:
- Lawful basis per purpose. Using purchase data for loyalty points and using the same data for profiling and targeted marketing may require different lawful bases. Record the purpose and basis alongside the data.
- Consent as data. Store consent flags from the CRM and loyalty platform with timestamps, and make every activation pipeline check them before a segment is pushed anywhere.
- Pseudonymization. Keep direct identifiers such as name, email, and phone in a restricted zone. Analysts work with
customer_key, not with personal details. - Erasure that propagates. A deletion request must remove the person from raw storage, the identity map, the model, and every downstream tool, and the platform must be able to prove it.
- Payment card data stays out. Never use raw card numbers as identifiers. If card-based matching is needed, use tokens supplied by the payment provider and keep the platform outside PCI DSS scope.
Retailers running older POS or ERP platforms often assume compliance requires replacing them first. It usually does not, as we explained in making legacy systems compliant.
Build vs Buy: CDP, Data Warehouse, or Both
The build versus buy question usually comes down to three options.
A packaged customer data platform (CDP) is fastest to start for marketing activation. It comes with connectors, identity resolution, and audience building. Its limits appear when you need finance-grade reporting, complex retail metrics such as margin after returns, or full control over the identity logic.
A custom data warehouse or lakehouse on Azure, AWS, or Google Cloud gives full control over the model, the metrics, and the cost. It takes longer to build, and it requires a team that can operate it.
The composable approach keeps the warehouse as the single source of truth and adds activation tools on top of it. The identity map and the metrics are owned by you, while marketing still gets audience building and campaign sync. For mid-size and large retailers with several source systems, this is now the most common choice because it avoids paying twice to store the same customer data.
A useful rule: if the main goal is campaign activation and your data is simple, start with a CDP. If the main goal is trusted analytics across sales, margin, loyalty, and customers, start with the warehouse and add activation later.
A Realistic Delivery Plan
A connected retail analytics platform is best delivered in phases, with each phase producing something the business uses.
- Discovery and audit. Define the priority decisions, profile the source systems, and agree on metric definitions.
- Foundation. Build ingestion for POS, CRM, and loyalty, raw storage, and the first version of the dimensional model. Deliver sales and store reporting that reconciles with finance.
- Identity. Implement deterministic matching, the identity map, and the customer dimension. Start reporting identification rate.
- Customer analytics. Add segments, retention, lifetime value, and loyalty performance with a governed metrics layer.
- Activation. Push segments and scores back into the CRM and loyalty platform, and launch the first measured campaigns.
- Advanced use cases. Add probabilistic matching, predictive models, and real-time triggers where the business case is proven.
The order matters. Reporting that reconciles with finance earns the trust that every later phase depends on. A churn model built on numbers the CFO does not believe will not be used.
Common Mistakes That Derail Retail Data Projects
Connecting everything at once. Ten source systems in the first release means ten sets of edge cases discovered at the same time. Start with POS, CRM, and loyalty, prove the value, then expand.
Treating identity as a one-time cleanup. Customers change emails, share cards, and create duplicate accounts every day. Identity resolution is a continuously running process with its own monitoring.
Dropping anonymous sales. Excluding unidentified transactions makes customer reports look clean and store reports look wrong. Keep them and measure them.
Letting each team define its own metrics. Without a semantic layer, the platform becomes one more source of conflicting numbers.
Ignoring data quality until launch. Gartner estimates that poor data quality costs organizations an average of 12.9 million dollars a year. Automated tests on row counts, null rates, duplicates, and reconciliation totals belong in the pipeline from the first week.
Building real-time first. Most retail decisions run on daily or weekly cycles. Real-time infrastructure should follow a proven use case, not precede it.
Frequently Asked Questions
What is a retail analytics platform? A retail analytics platform is a system that collects data from sources such as POS, CRM, loyalty, ecommerce, and inventory, integrates it into a consistent model, and makes it available for reporting, analysis, and activation. Its core value is a single, trusted view of customers, products, and stores.
Do I need a customer data platform to connect POS, CRM, and loyalty data? Not necessarily. A CDP is one way to do it, especially when the main goal is marketing activation. Many retailers get better long-term results by building the integration in their own data warehouse and adding activation tools on top.
How do you link in-store purchases to known customers? Through shared identifiers captured at checkout, such as loyalty card or app scans, digital receipts, phone numbers, or emails, combined with deterministic and probabilistic matching in the analytics platform. Increasing identification at the till is usually more effective than any matching algorithm.
How long does it take to build a retail analytics platform? It depends on the number and condition of source systems. A phased approach delivers trusted sales reporting first, then customer identity, then customer analytics and activation, so the business sees value early rather than waiting for one large launch.
Is it legal to combine purchase data with CRM and loyalty data under GDPR? It can be, provided you have a lawful basis for each purpose, respect consent for marketing uses, minimize and pseudonymize personal data, and can fulfil access and erasure requests across the whole platform. Legal advice for your specific case is always recommended.
The Takeaway
Connecting POS, CRM, and loyalty data is not primarily an integration problem. It is an identity problem, a definitions problem, and an ownership problem that happens to require integration to solve.
The retailers that succeed start with the decisions they want to improve, keep raw data untouched, treat customer identity as a permanent capability, define every metric once, and only then invest in real-time and AI use cases. The retailers that struggle start by connecting everything and hope the insight will appear.
The data is already there, in your tills, your CRM, and your loyalty platform. The platform that connects it is what turns it into a competitive advantage.
If you want to scope a retail analytics platform for your systems, explore our data engineering and analytics work, see our client projects, or contact the Marka team.